%pip install -q ebsdsim matplotlib wgpuNote: you may need to restart the kernel to use updated packages.dmin, more beams in the dynamical EBSD solve2026-06-11
ebsdsim computes Lambert-projected dynamical EBSD master patterns on the GPU (via WebGPU / wgpu). The keyword dmin sets the minimum d-spacing included in the reflection sphere, in nm. Smaller dmin → more beams → longer runtime.
This notebook runs the same Ni pattern at several dmin values and compares the results with a ⟨001⟩→⟨100⟩ line cut and a zoom on the ⟨001⟩ center.
Requires Python 3.10+ and a WebGPU-capable GPU (macOS Metal; Windows Vulkan or DirectX 12; Linux Vulkan). Run once per environment:
%pip install -q ebsdsim matplotlib wgpuNote: you may need to restart the kernel to use updated packages.%matplotlib inline
import time
import warnings
import matplotlib.pyplot as plt
import numpy as np
import ebsdsim as es
warnings.filterwarnings("ignore", category=UserWarning, module="matplotlib")
# None = raw; "minmax" or "robust" for display scaling via mp.lambert_data(...)
NORMALIZE = "minmax"
def nh_pattern(mp, *, normalize=NORMALIZE):
data, axes = mp.lambert_data(normalize=normalize)
e = axes["energy_integrated_index"]
s = axes["site_integrated_index"]
return data[e, s, 0]
def lambert_cube(mp, *, normalize=NORMALIZE):
return mp.lambert_data(normalize=normalize)
print("ebsdsim", es.__version__)ebsdsim 0.1.3dmin)Bundled preset "Ni.cif" (FCC, Fm-3m). Lambert raster halfw=250 → 501×501 pixels. Microscope settings: 20 kV, 70° tilt, surrogate Monte Carlo backend.
master_pattern* returns raw intensities. Figures below call mp.lambert_data(normalize="minmax") (per-channel min–max to [0, 1]). Change NORMALIZE in the imports cell to "robust" or None if you prefer.
COMMON_KW = dict(
    halfw=250,
    voltage_kv=20.0,
    sigma_deg=70.0,
    mc_backend="surrogate",
)

t0 = time.perf_counter()
mp = es.master_pattern_from_cif("Ni.cif", dmin=0.05, **COMMON_KW)
elapsed = time.perf_counter() - t0

print(f"raw pattern shape : {mp.pattern.shape}")
print(f"dmin (nm)         : {mp.metadata['dmin']}")
print(f"wall time (s)     : {elapsed:.1f}")
print(f"display normalize : {NORMALIZE!r}")
raw pattern shape : (501, 501)
dmin (nm) : 0.05
wall time (s) : 4.9
display normalize : 'minmax'fig, ax = plt.subplots(figsize=(5, 5), layout="constrained")
ax.imshow(nh_pattern(mp), cmap="gray")
ax.set_title(f"Ni, {mp.metadata['voltage_kv']:.0f} kV, dmin={mp.metadata['dmin']} nm")
ax.axis("off")
plt.show()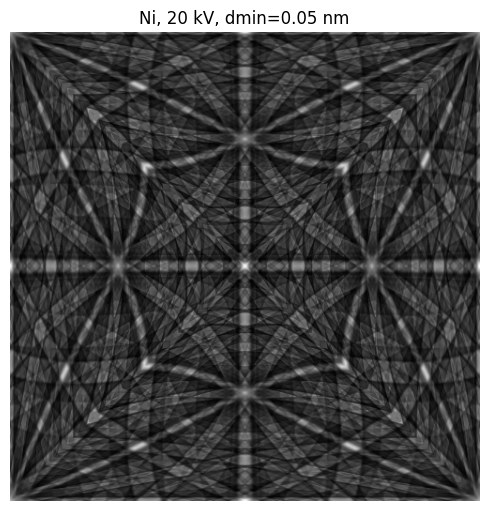
dmin sweepSame crystal and settings, five values of dmin. The first GPU run in a session includes warmup (shader compile, adapter init).
DMIN_VALUES = [0.10, 0.06, 0.05, 0.04, 0.03]
REF_DMIN = 0.05
REF_COL = DMIN_VALUES.index(REF_DMIN)
results = {}

for dmin in DMIN_VALUES:
    t0 = time.perf_counter()
    run = es.master_pattern_from_cif("Ni.cif", dmin=dmin, **COMMON_KW)
    wall_s = time.perf_counter() - t0
    results[dmin] = {"mp": run, "wall_s": wall_s}
    print(f"dmin={run.metadata['dmin']:>5} nm  wall={wall_s:5.1f} s  raw shape={run.pattern.shape}")
dmin= 0.1 nm wall= 2.0 s raw shape=(501, 501)
dmin= 0.06 nm wall= 3.1 s raw shape=(501, 501)
dmin= 0.05 nm wall= 3.7 s raw shape=(501, 501)
dmin= 0.04 nm wall= 4.3 s raw shape=(501, 501)
dmin= 0.03 nm wall= 10.5 s raw shape=(501, 501)patterns = [nh_pattern(results[d]["mp"]) for d in DMIN_VALUES]
vmin = min(p.min() for p in patterns)
vmax = max(p.max() for p in patterns)
fig, axes = plt.subplots(2, 3, figsize=(11, 7.5), layout="constrained")
for ax, dmin in zip(axes.ravel(), DMIN_VALUES):
pat = nh_pattern(results[dmin]["mp"])
wall_s = results[dmin]["wall_s"]
ax.imshow(pat, cmap="gray", vmin=vmin, vmax=vmax)
ax.set_title(f"dmin={dmin} nm ({wall_s:.1f} s)")
ax.axis("off")
fig.suptitle(f"Ni, {COMMON_KW['voltage_kv']:.0f} kV, halfw={COMMON_KW['halfw']}")
plt.show()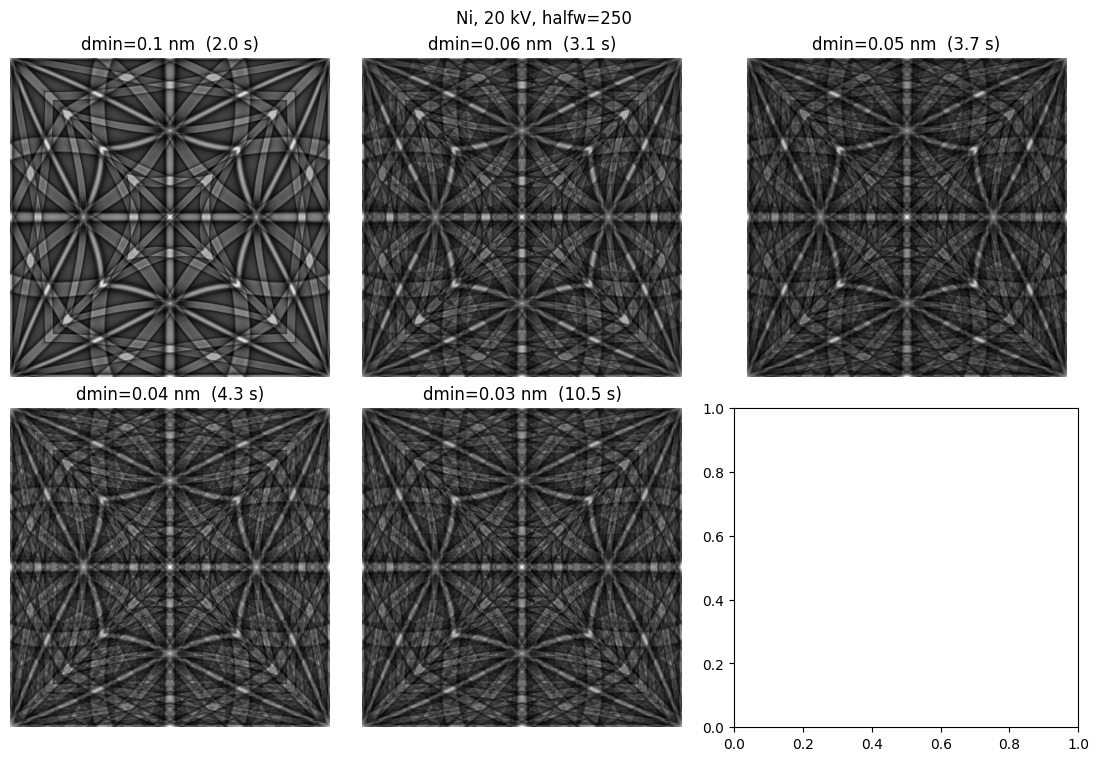
The pattern center is the ⟨001⟩ zone axis. Top row: a square window around that center (shared intensity scale). Bottom row: Δ = pattern − pattern(dmin=0.05); the reference column holds the color scale.
from mpl_toolkits.axes_grid1.inset_locator import inset_axes

ref_pat = nh_pattern(results[REF_DMIN]["mp"])
n = ref_pat.shape[0]
center = n // 2
half_span = 45
sl = slice(center - half_span, center + half_span + 1)
ref_zoom = ref_pat[sl, sl]

diff_vmax = max(
    np.abs(nh_pattern(results[d]["mp"])[sl, sl] - ref_zoom).max()
    for d in DMIN_VALUES
    if d != REF_DMIN
)

fig, axes = plt.subplots(2, len(DMIN_VALUES), figsize=(2.2 * len(DMIN_VALUES), 5.2), layout="constrained")
im = None

for j, dmin in enumerate(DMIN_VALUES):
    zoom = nh_pattern(results[dmin]["mp"])[sl, sl]
    axes[0, j].imshow(zoom, cmap="gray", vmin=ref_zoom.min(), vmax=ref_zoom.max())
    axes[0, j].set_title(f"dmin={dmin}", fontsize=10)
    axes[0, j].set_xticks([])
    axes[0, j].set_yticks([])
    if j == 0:
        axes[0, j].set_ylabel("intensity", fontsize=10)

    if dmin == REF_DMIN:
        axes[1, j].axis("off")
        if j == 0:
            axes[1, j].set_ylabel(f"Δ vs {REF_DMIN}", fontsize=10)
    else:
        diff = zoom - ref_zoom
        im = axes[1, j].imshow(diff, cmap="RdBu_r", vmin=-diff_vmax, vmax=diff_vmax)
        axes[1, j].set_xticks([])
        axes[1, j].set_yticks([])
        if j == 0:
            axes[1, j].set_ylabel(f"Δ vs {REF_DMIN}", fontsize=10)

cax = inset_axes(axes[1, REF_COL], width="16%", height="72%", loc="center", borderpad=0)
fig.colorbar(im, cax=cax, label="Δ intensity")
fig.suptitle("⟨001⟩ center zoom")
plt.show()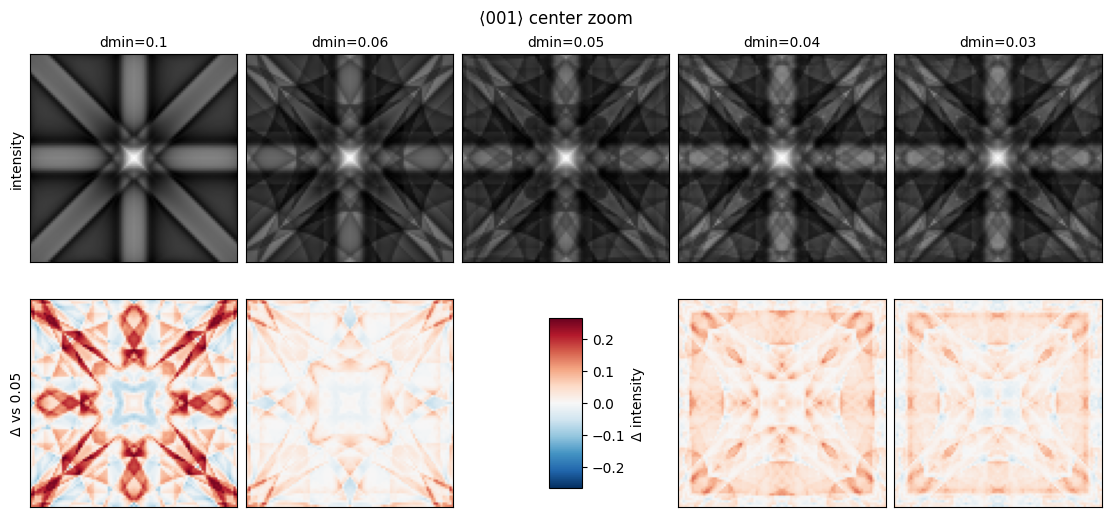
Horizontal profile from the center pixel (⟨001⟩) to the eastern raster edge (⟨100⟩). Left: cut location on the dmin=0.05 reference. Right: overlaid profiles for all dmin values.
def line_cut_001_to_100(pattern: np.ndarray) -> tuple[np.ndarray, np.ndarray, tuple[int, np.ndarray]]:
    """Center row, columns from center pixel eastward."""
    n = pattern.shape[0]
    row = n // 2
    cols = np.arange(row, n)
    profile = pattern[row, row:n]
    dist = cols - row
    return dist, profile, (row, cols)


dist, _, (row, cols) = line_cut_001_to_100(ref_pat)
colors = plt.cm.viridis(np.linspace(0.1, 0.9, len(DMIN_VALUES)))

fig, (ax_img, ax_prof) = plt.subplots(1, 2, figsize=(10, 4.2), layout="constrained", gridspec_kw={"width_ratios": [1.0, 1.2]})

ax_img.imshow(ref_pat, cmap="gray")
ax_img.plot(cols, np.full_like(cols, row), color="cyan", lw=1.5)
ax_img.plot(row, row, "o", color="cyan", ms=5)
ax_img.annotate("⟨001⟩", xy=(row, row), xytext=(row - 55, row - 40), color="cyan", fontsize=10,
                arrowprops=dict(arrowstyle="->", color="cyan", lw=1))
ax_img.annotate("⟨100⟩", xy=(n - 8, row), xytext=(n - 95, row + 45), color="cyan", fontsize=10,
                arrowprops=dict(arrowstyle="->", color="cyan", lw=1))
ax_img.set_title(f"cut path (dmin={REF_DMIN} nm)")
ax_img.axis("off")

for color, dmin in zip(colors, DMIN_VALUES):
    d, prof, _ = line_cut_001_to_100(nh_pattern(results[dmin]["mp"]))
    ax_prof.plot(d, prof, color=color, lw=1.4, label=f"{dmin} nm ({results[dmin]['wall_s']:.1f} s)")

ax_prof.set_xlabel("pixels east of ⟨001⟩")
ax_prof.set_ylabel("intensity")
ax_prof.set_title(f"⟨001⟩ → ⟨100⟩, Ni {COMMON_KW['voltage_kv']:.0f} kV")
ax_prof.legend(loc="upper right", fontsize=8)
ax_prof.grid(True, alpha=0.25)
plt.show()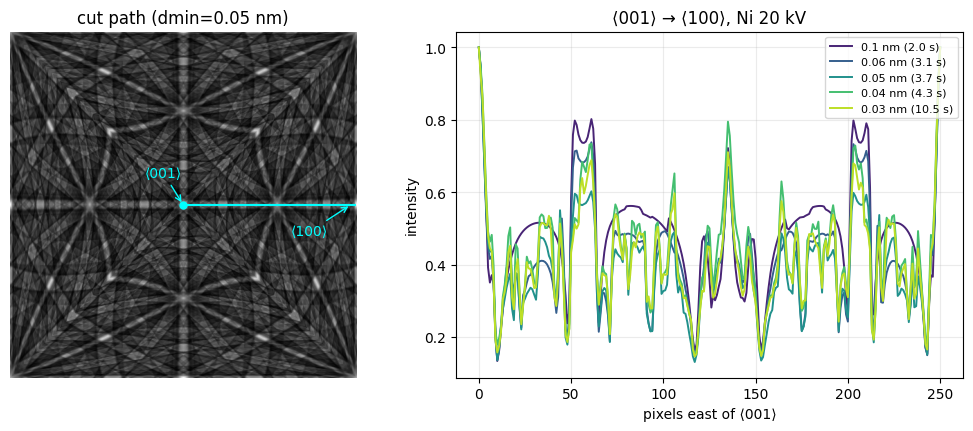
import importlib.resources

from ebsdsim.cif import parse_cif_crystal
from ebsdsim.lookup import prepare_diff_lookup_geometry
from ebsdsim.structure import build_cell_from_cif

ni_text = importlib.resources.files("ebsdsim").joinpath("data/preset_cifs/Ni.cif").read_text()
ni_cell = build_cell_from_cif(parse_cif_crystal(ni_text))

print(f"{'dmin (nm)':>10}  {'beams':>8}  {'wall (s)':>10}")
print("-" * 34)
for dmin in DMIN_VALUES:
    geom = prepare_diff_lookup_geometry(ni_cell, dmin)
    n_beams = geom.hkl.size // 3
    wall_s = results[dmin]["wall_s"]
    print(f"{dmin:10.2f}  {n_beams:8d}  {wall_s:10.1f}")
dmin (nm) beams wall (s)
----------------------------------
0.10 59 2.0
0.06 181 3.1
0.05 339 3.7
0.04 701 4.3
0.03 1639 10.5GaN has two sites (Ga, N) and needs_southern_hemisphere=True. The dense tensor mp.data has shape (E, S, H, side, side); see mp.axes for indices:
E: energy — mp.axes["energy_integrated_index"] is the integrated patternS: site — 0 is a site mean (weights not stored in the .npz); mp.axes["site_to_index"] maps Ga/N to rows 1 and 2H: hemisphere — 0 = north, 1 = southRaw SH at the same (i, j) as NH is not the antipode (it is a z-reflection partner: ⟨111⟩ vs ⟨11̄1⟩). Before differencing, align SH with sh[::-1, ::-1] — a 180° rotation in the Lambert square — so pixel (i, j) compares k with −k. A transpose alone only swaps the Lambert x and y axes and does not fix the pairing.
gan_mp = es.master_pattern_from_cif("GaN.cif", dmin=0.05, **COMMON_KW)

site_symbols = [site["symbol"] for site in gan_mp.metadata["cell"]["sites"]]
site_rows = gan_mp.axes["site_to_index"]

print("raw data shape           :", gan_mp.data.shape)
print("needs_southern_hemisphere:", gan_mp.metadata["needs_southern_hemisphere"])
print("site_to_index            :", dict(zip(site_symbols, site_rows)))
print("hemispheres              :", gan_mp.axes["hemispheres"])
raw data shape : (11, 3, 2, 501, 501)
needs_southern_hemisphere: True
site_to_index : {'Ga': 1, 'N': 2}
hemispheres : ['north', 'south']gan_data, gan_axes = lambert_cube(gan_mp)
e = gan_axes["energy_integrated_index"]
s_int = gan_axes["site_integrated_index"]
nh_int = gan_data[e, s_int, 0]
sh_int = gan_data[e, s_int, 1]
print("site-integrated NH :", nh_int.shape)
print("site-integrated SH :", sh_int.shape)
for sym, row in zip(site_symbols, site_rows):
print(f"{sym:>2} NH only : gan_data[e, {row}, 0] shape {gan_data[e, row, 0].shape}")
print(f"{sym:>2} SH only : gan_data[e, {row}, 1] shape {gan_data[e, row, 1].shape}")site-integrated NH : (501, 501)
site-integrated SH : (501, 501)
Ga NH only : gan_data[e, 1, 0] shape (501, 501)
Ga SH only : gan_data[e, 1, 1] shape (501, 501)
N NH only : gan_data[e, 2, 0] shape (501, 501)
N SH only : gan_data[e, 2, 1] shape (501, 501)# Align SH so raster (i, j) samples the antipode of NH (Lambert x,y -> SH at -x,-y).
sh_aligned = sh_int[::-1, ::-1]
nh_minus_sh = nh_int - sh_aligned
diff_lim = np.max(np.abs(nh_minus_sh))
fig, axes = plt.subplots(1, 3, figsize=(11, 3.8), layout="constrained")
axes[0].imshow(nh_int, cmap="gray")
axes[0].set_title("NH, site-integrated")
axes[0].axis("off")
axes[1].imshow(sh_aligned, cmap="gray")
axes[1].set_title("SH, rotated 180° in square")
axes[1].axis("off")
axes[2].imshow(nh_minus_sh, cmap="RdBu_r", vmin=-diff_lim, vmax=diff_lim)
axes[2].set_title("NH − SH (aligned antipodes)")
axes[2].axis("off")
fig.suptitle(f"GaN, {gan_mp.metadata['voltage_kv']:.0f} kV, dmin={gan_mp.metadata['dmin']} nm")
plt.show()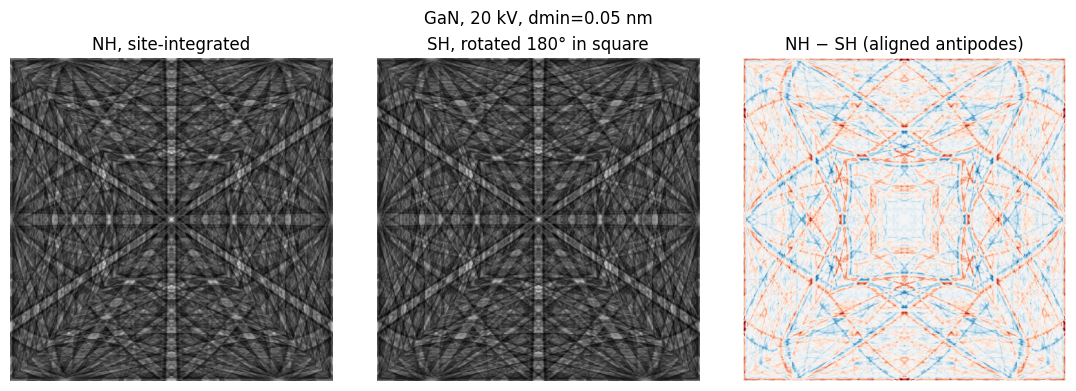
01_quick_start.ipynb, 02_save_and_load.ipynbmp.save("file.npz"), ebsdsim.mploader.load_master_pattern